Diagnostics > Taxonomy
Where can inference go wrong?
A taxonomy of epistemic uncertainties in SBI: three failure modes, each with its own diagnostic strategy.
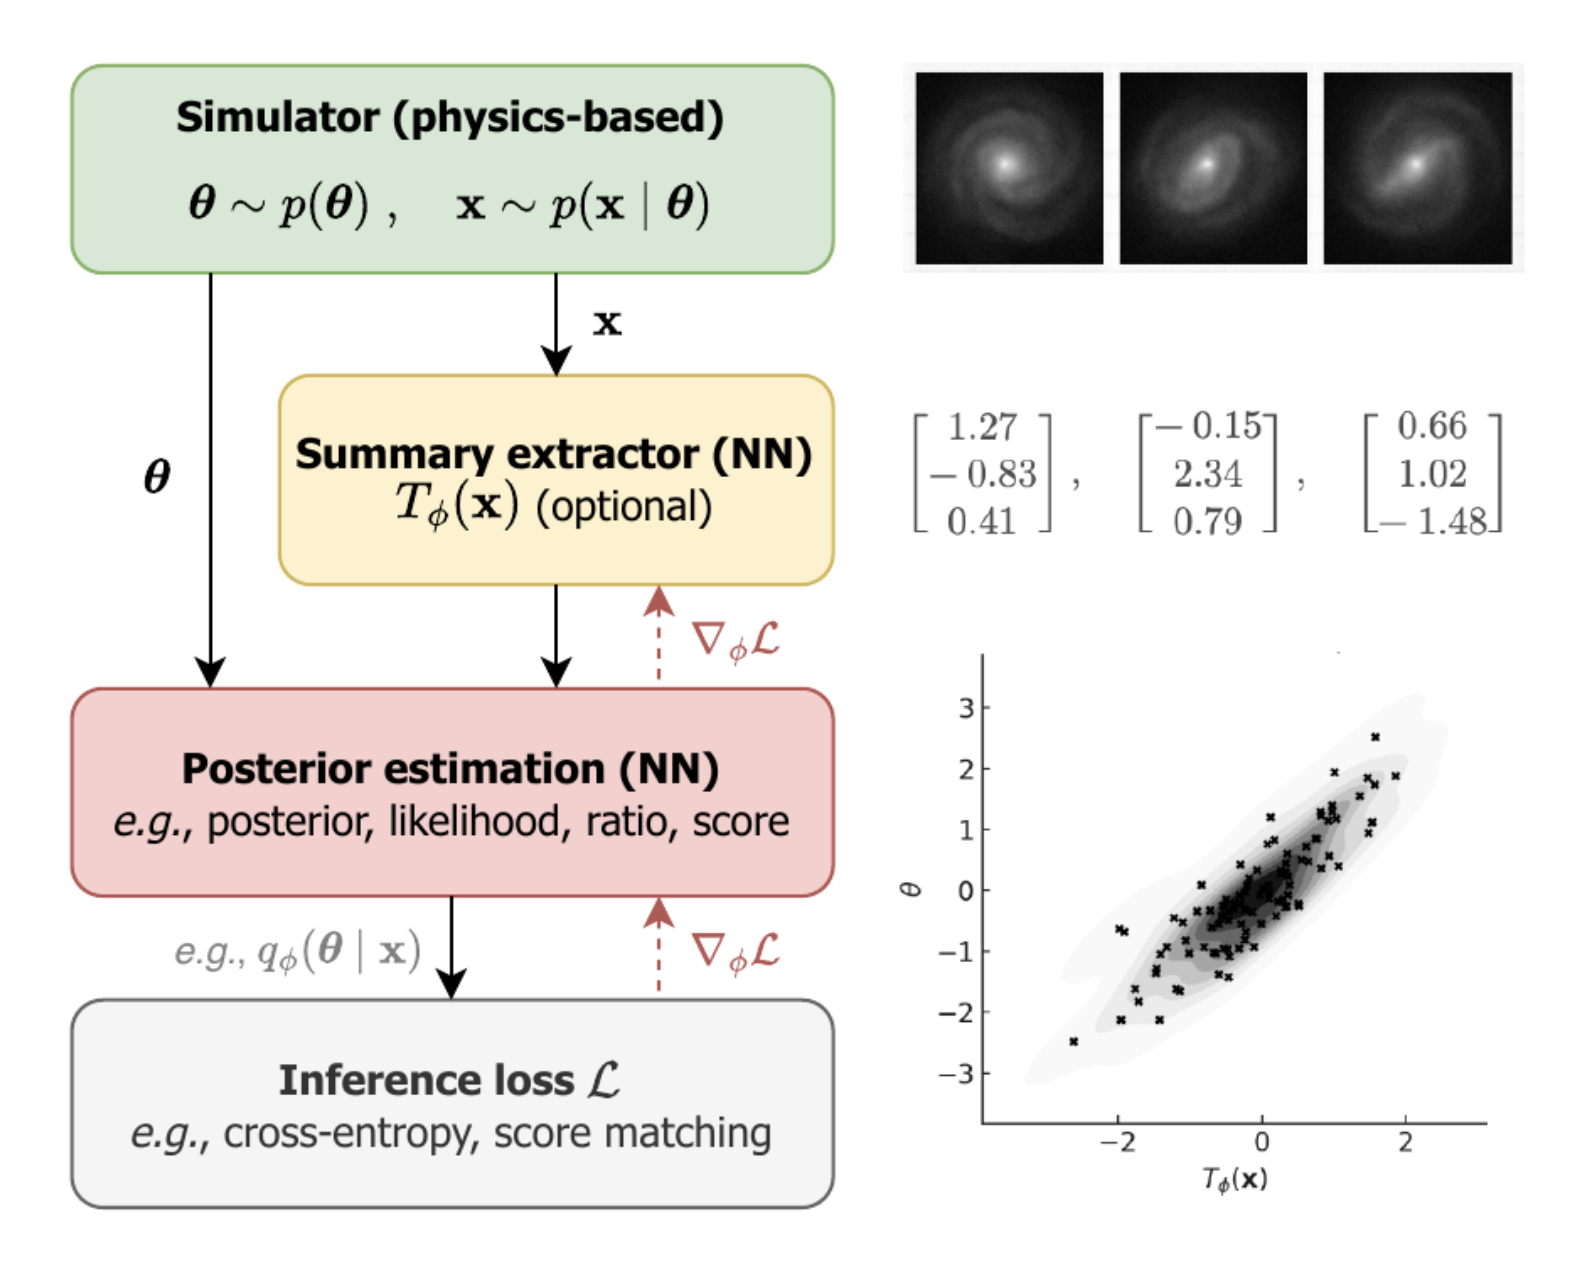
| Category | Type | Description |
|---|---|---|
| Epistemic | Epi-R | Reality Gap "I'm simulating the wrong system" |
| Epi-C | Compression Gap "I'm discarding relevant information" |
|
| Epi-A | Approximation Gap "I can't compute the posterior exactly" |
|
| Aleatoric | Ale | Irreducible randomness in the system and data |
Diagnostics > Failure modes
Overdispersion vs lossy summaries
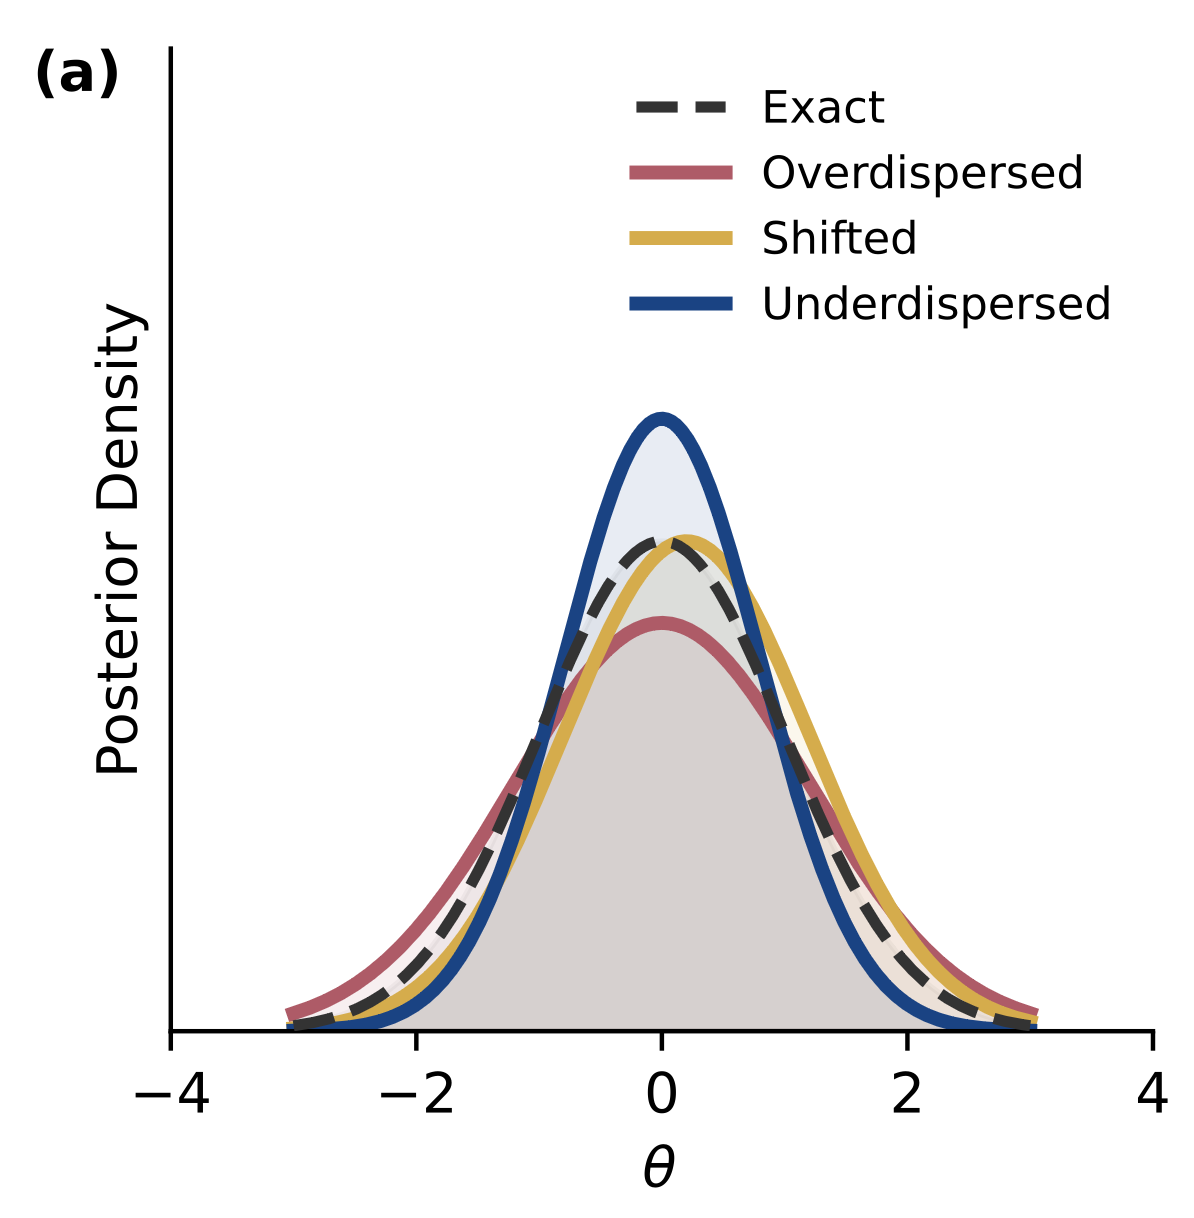
Approximate posteriors \(q_\phi(\theta \mid x)\) are overdispersed (underdispersed) when they overestimate (underestimate) their coverage of the data-generating parameters (example for Epi-A).
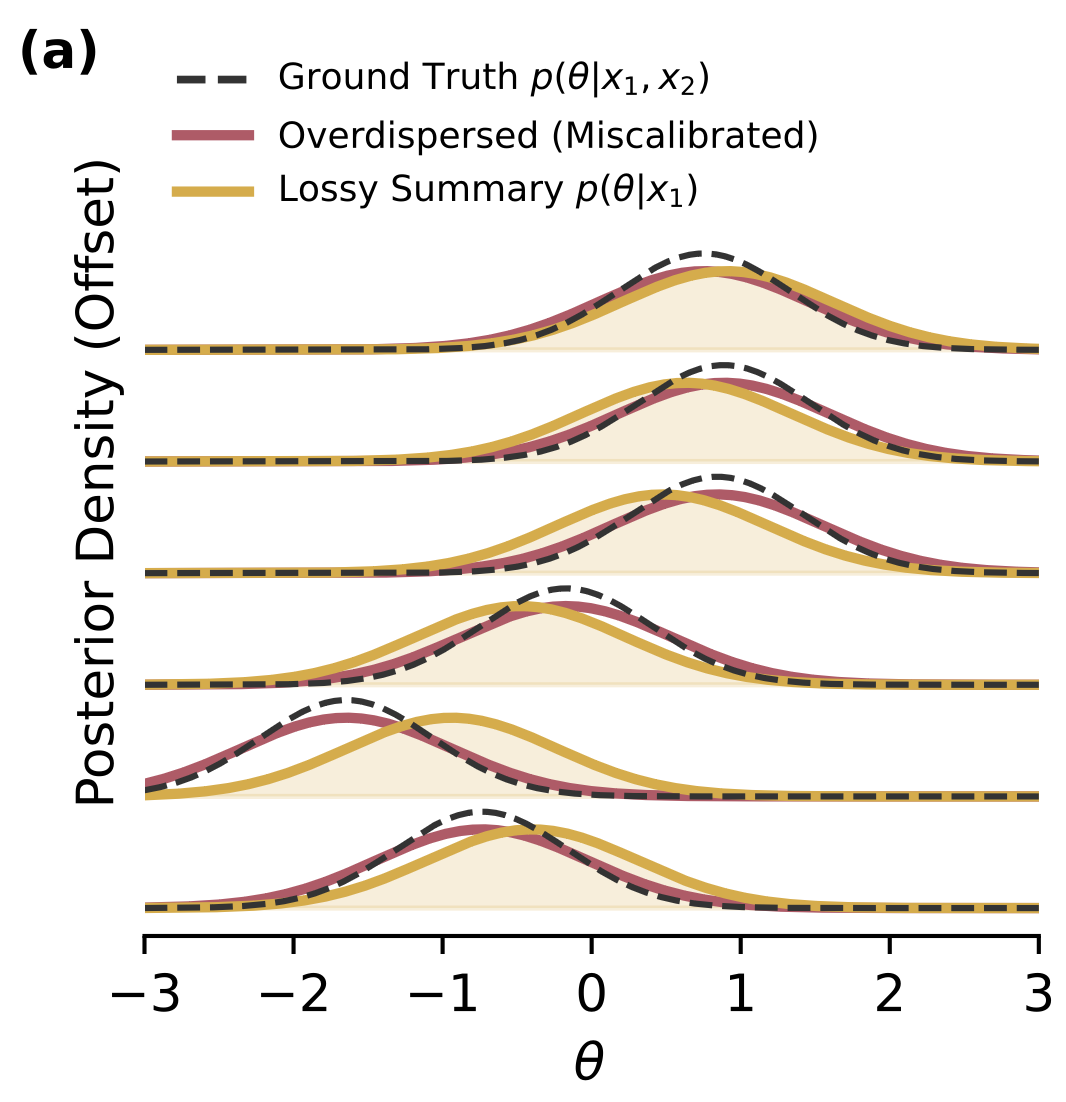
Posteriors that are exact but based on a lossy summary, \(q_\phi(\theta \mid x) = p(\theta \mid T(x))\), are wider and not overdispersed. Their width correctly represents the information loss, and the extra scatter in the posterior position exactly compensates. This is Epi-C.
Diagnostics > Reference posteriors
Comparing against a reference posterior
The most direct question you can ask: does the learned posterior agree with one we already trust?
Reference may be available as unnormalised explicit posterior, through Fisher approximation, or MCMC samples, etc.
- Epi-C shows up as a learned posterior that is broader than the reference, but centred correctly.
- Epi-A shows up as bias, missing modes, or other structural distortions.
- Epi-R now enters too: SBI and likelihood-based methods may respond differently when the model is wrong. A disagreement here is informative but ambiguous.
Cannon, Ward & Schmon 2022, arXiv:2209.01845 (misspecification and SBI) · review: Cranmer, Brehmer & Louppe 2020, arXiv:1911.01429.
Diagnostics > Reference posteriors
Which divergence, and what it is sensitive to
A divergence quantifies the difference between two distributions. They all vanish when \(p = q\), and they weight disagreements very differently.
| Divergence | generator \(f(t)\) |
|---|---|
| KL, \(D_\mathrm{KL}(p\|q)\) | \(t\log t\) |
| Neyman \(\chi^2\) | \((t-1)^2\) |
| Jeffreys, \(D_J(p;q)\) | \((t-1)\log t\) |
| Jensen-Shannon | \(\tfrac{1}{2}\!\left(t\log t - (t{+}1)\log\tfrac{t+1}{2}\right)\) |
| Total variation | \(\tfrac{1}{2}|t-1|\) |
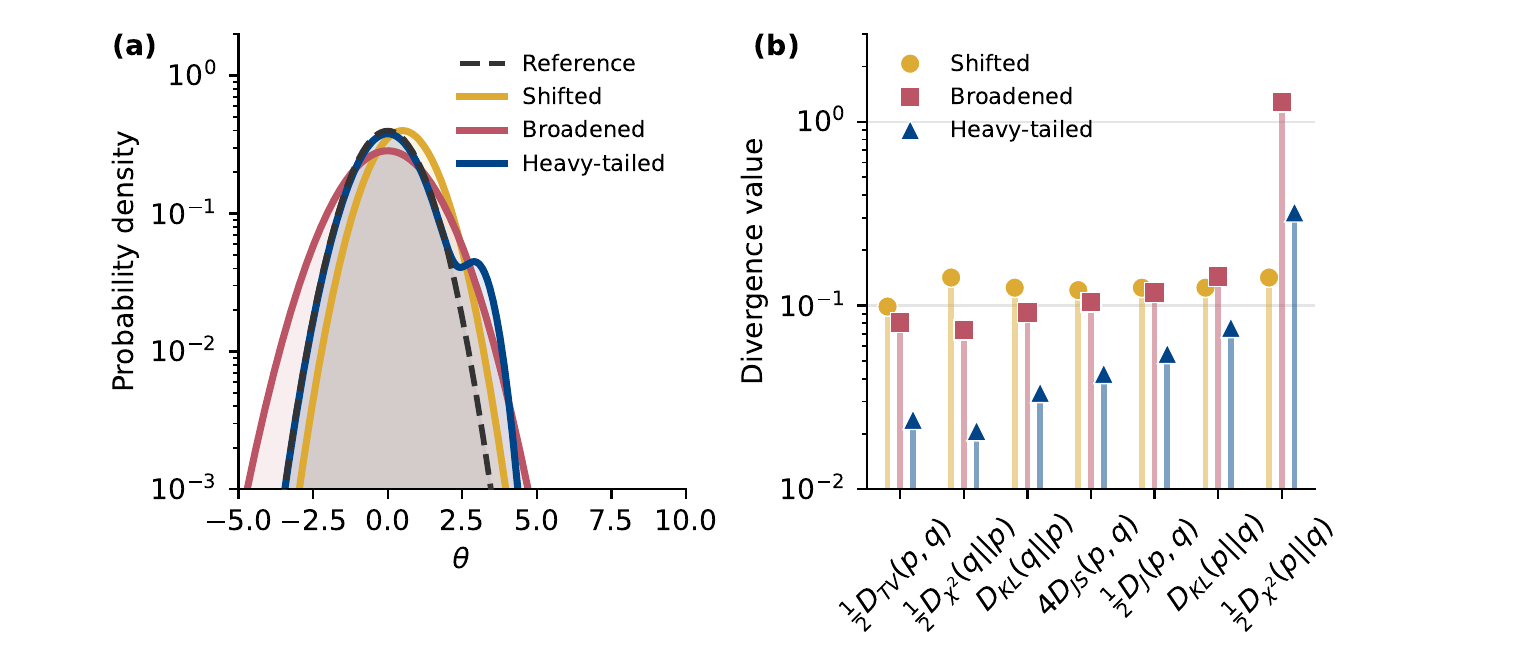
Values are rescaled by \(f''(1)\) so that a shifted posterior gives comparable numbers, and ordered by sensitivity to unmodelled modes.
Diagnostics > Reference posteriors
Estimating a divergence from samples
Diagnostics > Forward-backward
When there is no reference: forward-backward consistency
If no trustworthy reference posterior exists, one can use self-consistency checks: comparing joint samples from the backward model and the forward model.
If \(q_\phi(\boldsymbol\theta\mid\mathbf{x}) = p(\boldsymbol\theta\mid\mathbf{x})\) the two joint distributions coincide exactly. Conversely, any discrepancy is a clear indicator of inference error.
Talts et al. 2018 (SBC), arXiv:1804.06788 · Cook, Gelman & Rubin 2006, JCGS 15, 675 · Modrák et al. 2023 (what the histogram can and cannot see), arXiv:2211.02383.
Diagnostics > Forward-backward · SBC
Simulation-based calibration
Algorithm:
- Draw \(\theta^*\sim p(\theta^*)\) from the prior.
- Run the simulator to get \(x \sim p(x\mid\theta^*)\).
- Draw \(L\) samples \(\theta_{1:L}\) from the learned posterior \(q_\phi(\theta\mid x)\).
- Record the rank of \(\theta^*\) among them. \[ F(\theta^*) = \tfrac{1}{L}\sum_{i=1}^{L} \mathbb{1}(\theta_i \le \theta^*) \]
- Repeat \(N\) times; histogram the ranks.
"Prior, then simulator" is the same thing as "\(x\sim p(x)\), then \(\theta^*\sim p(\theta\mid x)\)". Under \(q_\phi = p\) all \(L+1\) rank positions are equally likely, so the histogram is flat.
Diagnostics > Forward-backward · Coverage
Highest-posterior coverage tests
Algorithm:
- Draw \(\theta^*\sim p(\theta^*)\) from the prior.
- Run the simulator to get \(x \sim p(x\mid\theta^*)\).
- Draw \(L\) samples \(\theta_{1:L}\) from the learned posterior \(q_\phi(\theta\mid x)\).
- Record the rank of \(\theta^*\) among them. \[ F(\theta^*) = \tfrac{1}{L}\sum_{i=1}^{L} \mathbb{1}(q_i \ge q^*) \]
- Repeat \(N\) times; histogram the ranks.
Only step 4 differs from SBC: rank by density \(q_i \equiv q_\phi(\theta_i\mid x)\), not by value. Flat now means correct highest-posterior-density coverage.
Diagnostics > Failure modes
Three ways these tests go blind
A flat rank histogram is necessary, not sufficient. Three distinct failures survive it, and each has a different fix.
Fix: stratify by anything the miscalibration might depend on, signal-to-noise, sky location, observing run. The cost is statistical power per stratum.
Fix: an ordering function that uses the model, such as the likelihood or the score, rather than only the learned posterior.
Fix: combine orderings. HPDR, central interval, one-sided limits and plain SBC each close a different blind direction.
Diagnostics > Failure modes
Each test has a whole family of blind spots
Each tests probes the contained mass of superlevel sets defined by the ordering function. Tests are blind to mass transport along the fibers of the ordering function.
\(^\ast\)Construct \(q(\theta) = g(|\theta - \theta_0|)\) so that every symmetric interval around \(\theta_0\) carries exactly the true posterior mass. Then the HPDR pp-plot is diagonal by construction, no matter how distorted the shape becomes.
Diagnostics > Failure modes
Overdispersed, or just lossy?
Algorithm:
- Draw \(\theta^*\sim p(\theta^*)\) from the prior.
- Run the simulator to get \(x_1, x_2 \sim p(x\mid\theta^*)\).
- Draw \(L\) samples \(\theta_{1:L}\) from the learned posterior \(q_\phi(\theta\mid x)\).
- Record the rank of \(\theta^*\) under the ordering \(f\): \[ F(\theta^*) = \tfrac{1}{L}\sum_{i=1}^{L} \mathbb{1}\bigl(f(\theta_i) \ge f(\theta^*)\bigr) \]
- Repeat \(N\) times; histogram the ranks.
Two observations, so \(p(\theta\mid x_1,x_2)=\mathcal{N}\bigl(\tfrac{x_1+x_2}{2},\tfrac{\sigma^2}{2}\bigr)\). Both \(q\) are wider than that. Only an ordering that reads the full data sees the lossy one.
Diagnostics > Generalization
Generalized rank diagnostics: one framework
All forward-backward tests share a structure: choose an ordering function \(f(\boldsymbol\theta, x)\) and rank \(\theta^*\) among the \(\theta_{1:L}\) under that ordering.
| Method | Ranks by | Tests Epi-C | Ordering \(f(\boldsymbol\theta, x)\) |
|---|---|---|---|
| SBC | parameter (\(d\) tests) | No | \(\theta_i\) for \(i=1,\ldots,d\) |
| HPDR coverage | learned posterior | No | \(q_\phi(\boldsymbol\theta\mid x)\) |
| TARP | distance to reference | No/Yes | \(\|\boldsymbol\theta - \boldsymbol\theta'\|^2\) |
| Likelihood ranks | likelihood | Yes | \(p(x\mid\boldsymbol\theta)\) |
| True HPDR | true posterior | Yes | \(\pi(\boldsymbol\theta\mid x) \propto p(x\mid\boldsymbol\theta)p(\boldsymbol\theta)\) |
Lemos et al. 2023 (TARP), arXiv:2302.03026 · Modrák et al. 2023 (the choice of test quantity shapes sensitivity), arXiv:2211.02383.
Diagnostics > Misspecification
Model Misspecification (Epi-R): two starting points
Two separable questions about the simulator, joined by a named deviation of amplitude \(\eta\).
\(p(\mathbf{x}\mid\boldsymbol\theta)\) — baseline simulator.
\(p_\eta(\mathbf{x}\mid\boldsymbol\theta)\) — augmented simulator: consider one named deviation, amplitude \(\eta\), with \(p_{\eta=0} = p\).
\(p^*(\mathbf{x}\mid\boldsymbol\theta)\) — the real data generating process; typically never sampled.
"Is there an indication of a deviation?"
- Test statistic: discriminator between \(p\) and \(p_\eta\).
- Null from simulation: one observation suffices.
- Detections or exclusions on \(\eta\).
- \(q_\phi\) frozen: trained on \(p\), evaluated on \(p_\eta\). No retraining.
- Same coverage test, different simulator.
|
Step 1 ↓ Step 2 → |
inference insensitive | inference sensitive |
|---|---|---|
| no deviation found | fine, and you can say why | the dangerous cell |
| deviation found | model wrong, but it doesn't matter | fix the simulator |
Some literature on misspecification in SBI: Cannon, Ward & Schmon 2022, arXiv:2209.01845 · Ward et al. 2022 (robust SBI), arXiv:2209.11057 · posterior predictive checks: Gelman, Meng & Stern 1996, Statist. Sinica 6, 733.
Diagnostics > Misspecification
Hypothesis testing at volume
SBI enables the massively parallelize hypothesis testing to search for localized or aggregated devitations in data.
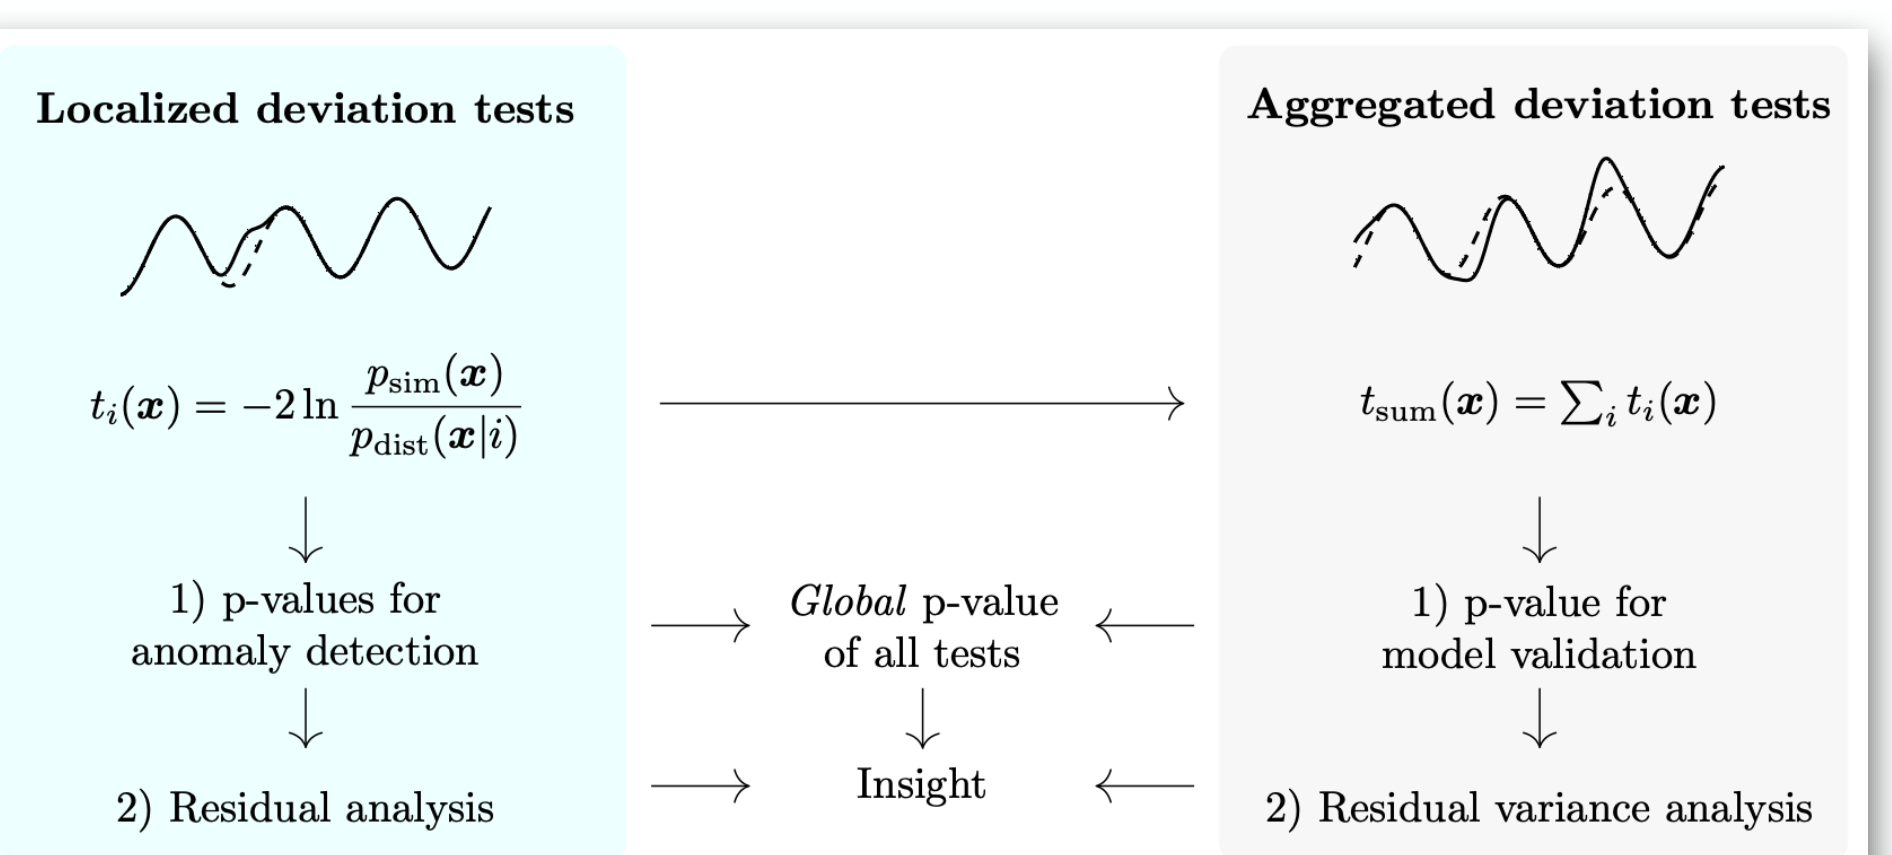
- Network training is cheap, enabling a broad battery of tests to probe many forms of distortion.
- Provides p-values for both local anomalies and global goodness-of-fit, offering structured diagnostics.
- Method is ready for real data, illustrated here on the landmark GW150914 event.
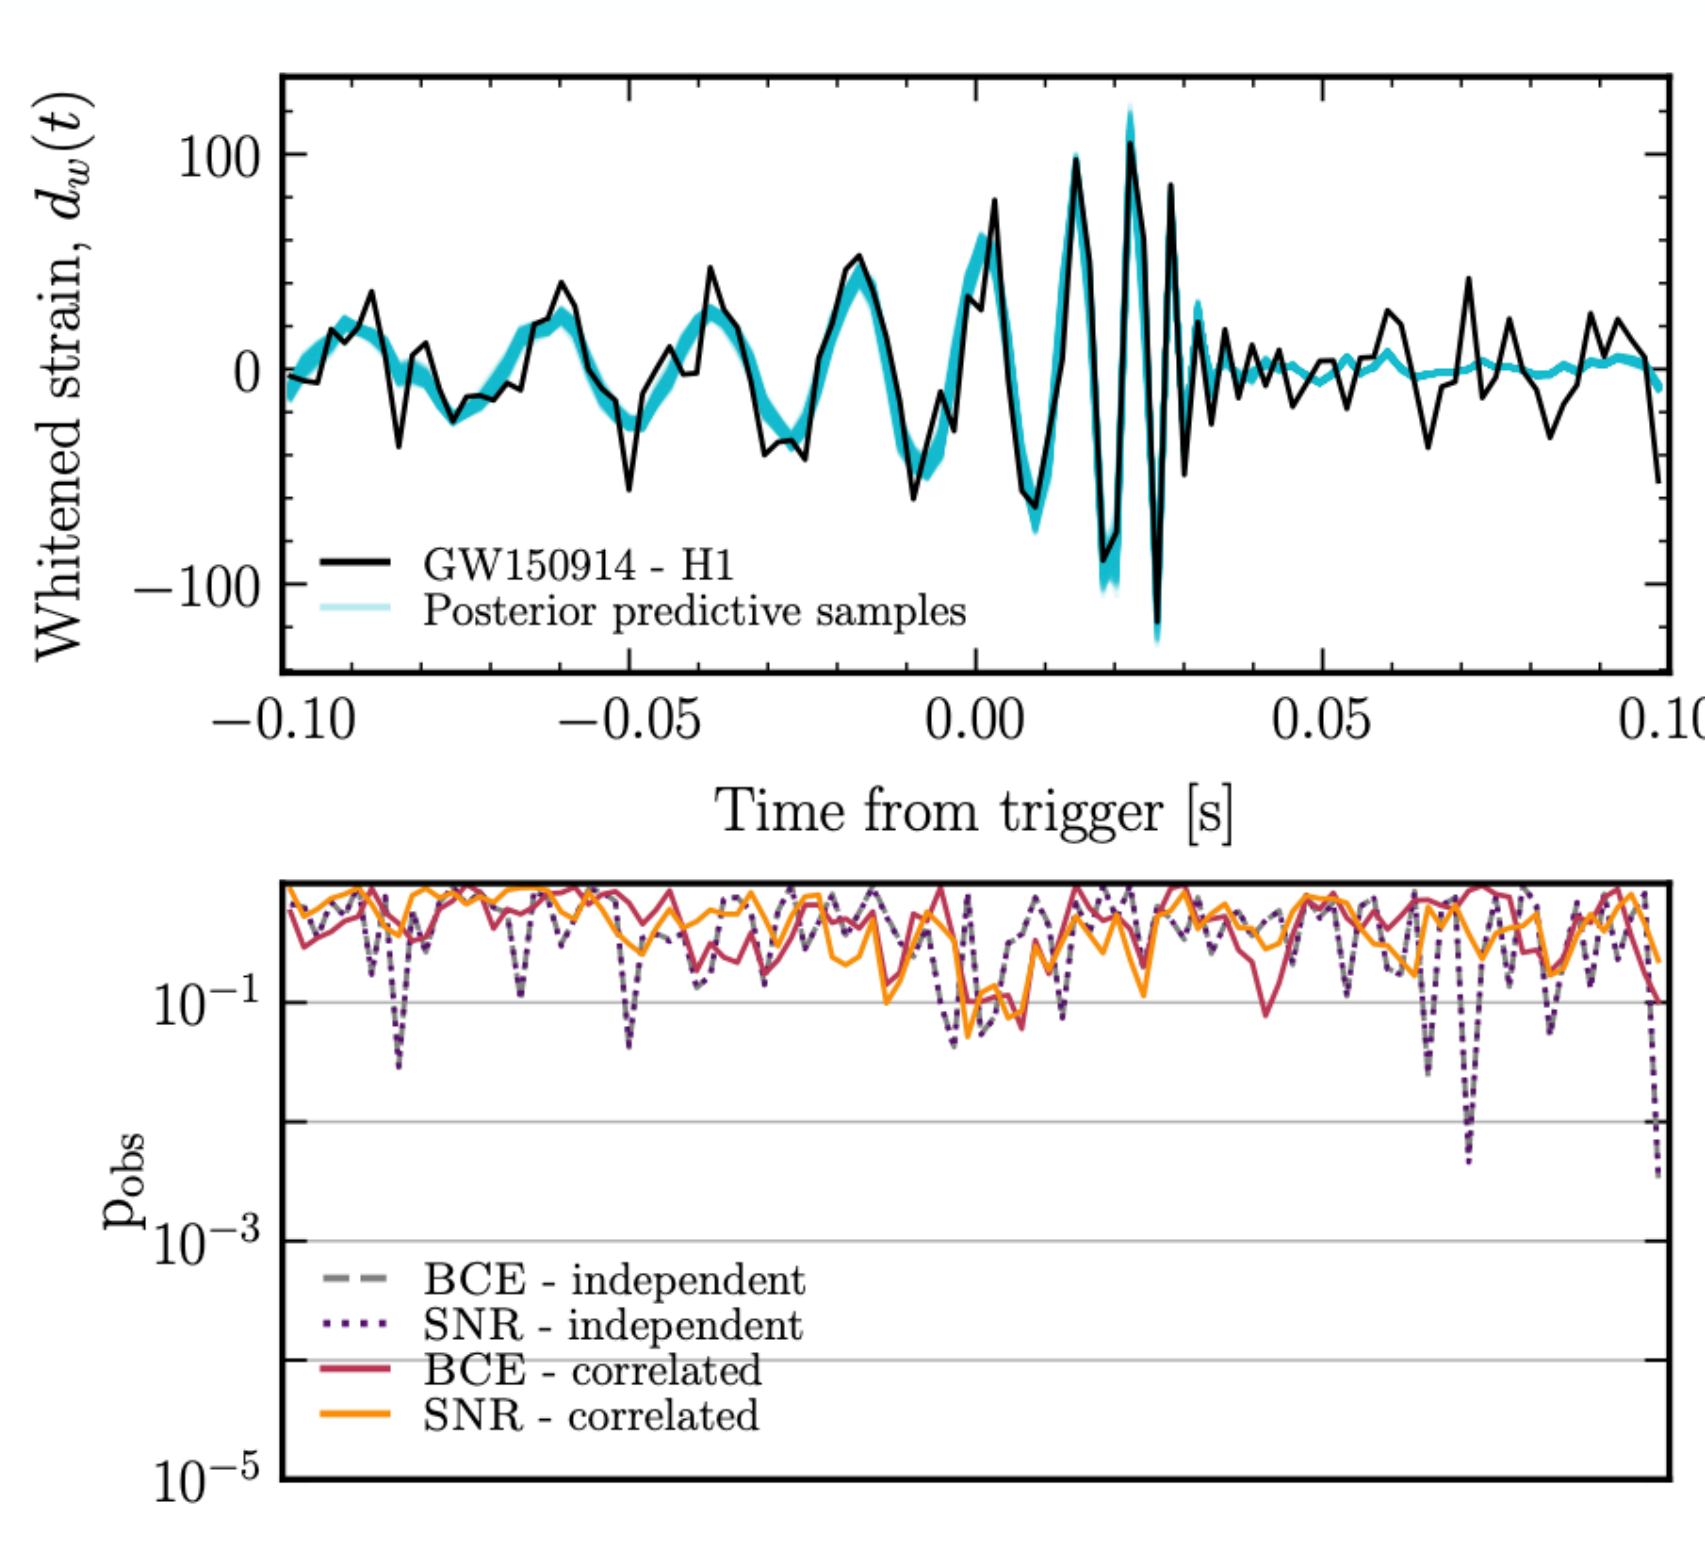
Noemi Anau Montel (MPA) · Anau Montel, Alvey & Weniger 2024, arXiv:2412.15100
Sequential methods > SNPE
Sequential neural posterior estimation
Amortised NPE spends its whole simulation budget covering the prior, so that any observation can be answered. If there is only one \(\mathbf{x}_\mathrm{obs}\), almost all of that budget is spent on data you will never see.
Strategy
- Run NPE on a small number of simulations from the prior.
- Update the proposal based on the learned posterior.
- Repeat until the proposal is concentrated around \(\mathbf{x}_\mathrm{obs}\).
Papamakarios & Murray 2016, arXiv:1605.06376 · Lueckmann et al. 2017, arXiv:1711.01861 · Greenberg, Nonnenmacher & Macke 2019, arXiv:1905.07488 · Deistler, Goncalves & Macke 2022, arXiv:2210.04815.
Sequential methods > The proposal problem
A proposal is not a prior
Train on pairs drawn from \(\tilde p(\boldsymbol\theta)\,p(\mathbf{x}\mid\boldsymbol\theta)\) and the NLL minimiser is not the posterior any more. It is the proposal posterior:
Four families of fixes, and they differ mainly in where the correction is applied.
- Correct afterwards (SNPE-A). Train normall, then divide the learned density by the ratio \(\tilde p/p\) analytically. Requires MCMC run afterwards.
- Correct in the loss (SNPE-B). Keep the target as the true posterior and reweight each training pair by importance weights \(w_n = p(\boldsymbol\theta_n)/\tilde p(\boldsymbol\theta_n)\).
- Correct in the model (SNPE-C). Parameterise the proposal posterior instead, as \(\tilde q_{\phi}(\boldsymbol\theta\mid\mathbf{x}) \propto q_\phi(\boldsymbol\theta\mid\mathbf{x})\, \tilde p(\boldsymbol\theta)/p(\boldsymbol\theta)\), and normalise it on an atomic set of \(\theta\) drawn from the batch.
- Avoid the problem (Truncation). Do not reshape the prior, cut it. Restrict to a region that contains almost all the posterior mass and set the proposal to the prior restricted there.
Papamakarios & Murray 2016 (A), arXiv:1605.06376 · Lueckmann et al. 2017 (B), arXiv:1711.01861 · Greenberg et al. 2019 (C / APT), arXiv:1905.07488 · Miller et al. 2021 (truncated marginal), arXiv:2107.01214 · Deistler et al. 2022 (truncated SNPE), arXiv:2210.04815.
Sequential methods > Prior independence
Or: learn something the prior cannot spoil
The correction problem exists only because NPE learns \(q_\phi(\boldsymbol\theta\mid\mathbf{x})\), an object that contains the prior. Target something that does not, and sequential training needs no correction whatsoever.
The likelihood \(p(\mathbf{x}\mid\boldsymbol\theta)\) is a property of the simulator alone. Where you choose to draw the \(\boldsymbol\theta\) changes only which region gets fitted well, never what the correct answer is.
Sample the posterior at the end with MCMC on \(q_\phi \, p(\boldsymbol\theta)\), using the real prior.
The likelihood-to-evidence ratio is likewise prior-free. Train the classifier on proposal-drawn pairs, then apply the ratio to whichever prior you actually want:
Combined with truncation this is TMNRE: cut the prior box round by round, train marginals directly, no reweighting anywhere.
Papamakarios, Sterratt & Murray 2019 (SNL), arXiv:1805.07226 · Hermans, Begy & Louppe 2020 (SNRE), arXiv:1903.04057 · Miller et al. 2021 (TMNRE), arXiv:2107.01214.
Sequential methods > Truncation
Rounds in action — and where they stop
Fixed budget of 400 simulations per round, drawn from the prior restricted to the current box — the proposal is a cut, not a fitted density. Learn \(q_\phi(\boldsymbol\theta\mid\mathbf{x}_\mathrm{obs})\), truncate to its \(3\sigma\) marginals, repeat.
| round | 1 |
| box (θ₁ × θ₂) | 12.0 × 12.0 |
| volume vs prior | 1 |
| sample spacing Δ | 0.54 |
| Δ / σpost | 3.1 |
The prior box is far wider than the posterior: almost every simulation lands where \(\mathbf{x}_\mathrm{obs}\) could never have come from.
Truncation stalls at the information floor — the exact posterior's own \(3\sigma\) width, set by the measurement noise. There \(\Delta\) has dropped below \(\sigma_\mathrm{post}\) and the surviving models differ by less than that noise. There is nothing left to cut.
Illustration only: \(q_\phi\) here is the exact posterior blurred by the sample spacing \(\Delta\propto\sqrt{V_\mathrm{box}/N}\), standing in for a network that cannot resolve structure finer than the gaps between its training points. No network is trained.
Miller et al. 2021 (TMNRE), arXiv:2107.01214 · Deistler, Goncalves & Macke 2022 (truncated SNPE), arXiv:2210.04815.
Sequential methods > EMRIs
Cornering an EMRI — not yet a posterior
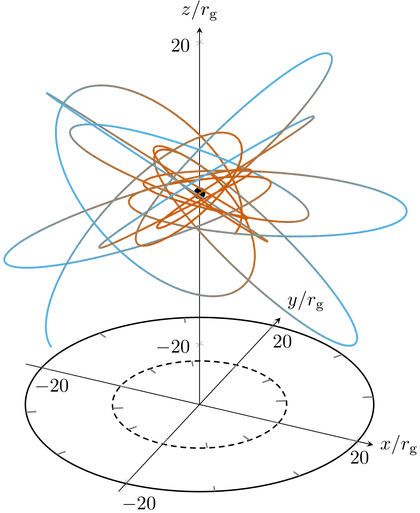
- The problem. A stellar-mass object spiralling through \(10^4\)–\(10^5\) strong-field orbits of a \(10^4\)–\(10^7\,M_\odot\) black hole: long, harmonic-rich, GPU-expensive waveforms over a vast, multi-modal 11-D space.
- The scheme. TMNRE, as on the previous slide: six rounds of \(1.5\times10^5\) waveform + LISA-response simulations, \(\sim\)14 h per round on one A100, cutting each marginal prior where the ratio drops below \(10^{-5}\).
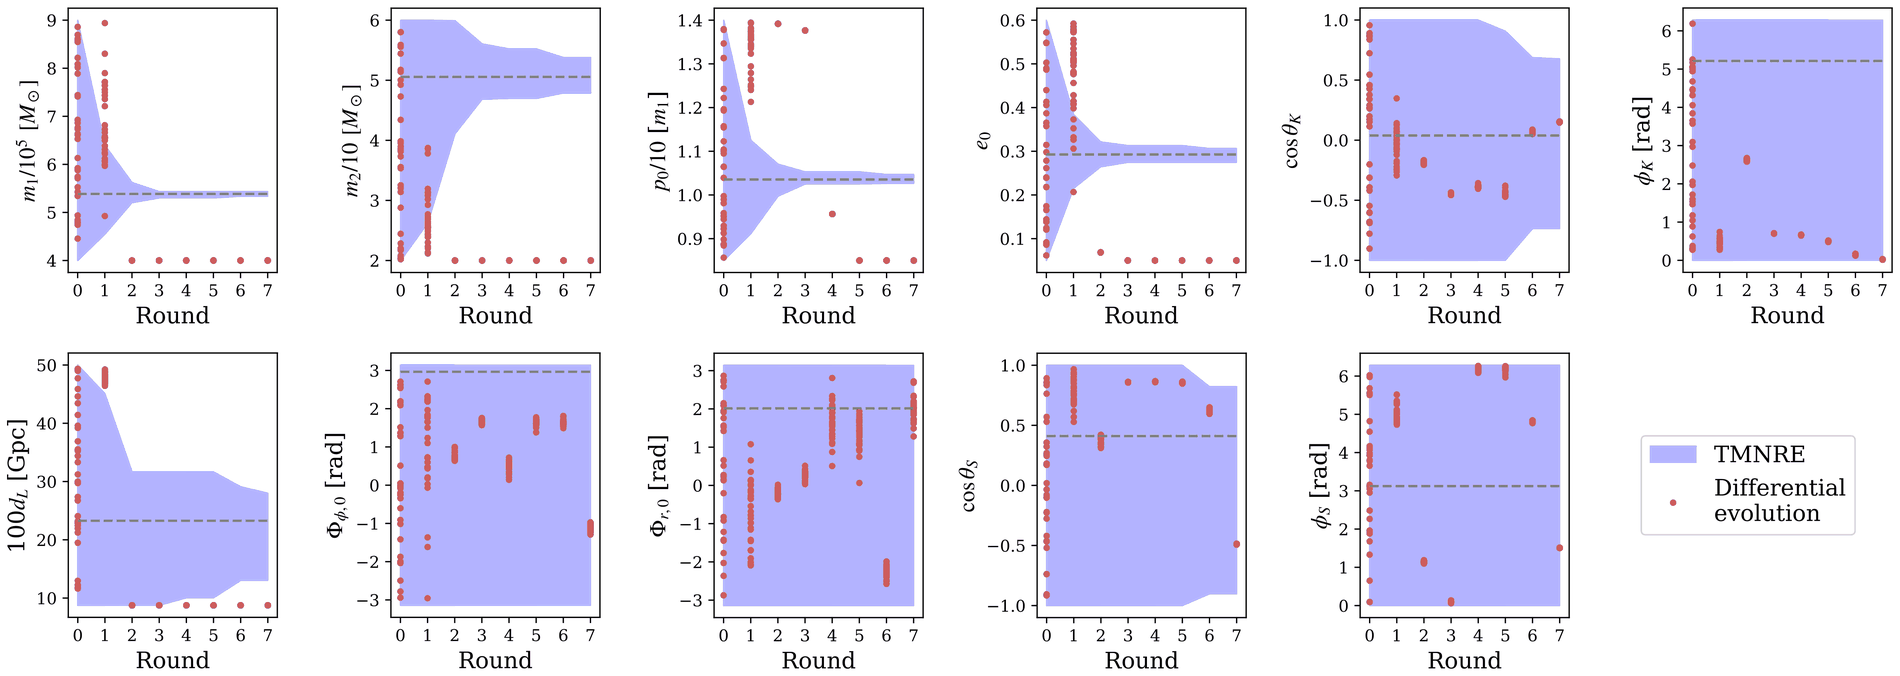
Top left: the 3-D panel of figure 1 of Berry et al. 2019. Below: figure 3 of Cole et al. 2026, its 11 panels re-tiled 6×2 here.
Cole et al. 2026 (sequential SBI for EMRIs), Phys. Rev. D 113, 063030, arXiv:2505.16795 · Berry et al. 2019 (the EMRI science case), arXiv:1903.03686.
Falcon > Motivation
Sufficiently realistic simulation models are DAGs
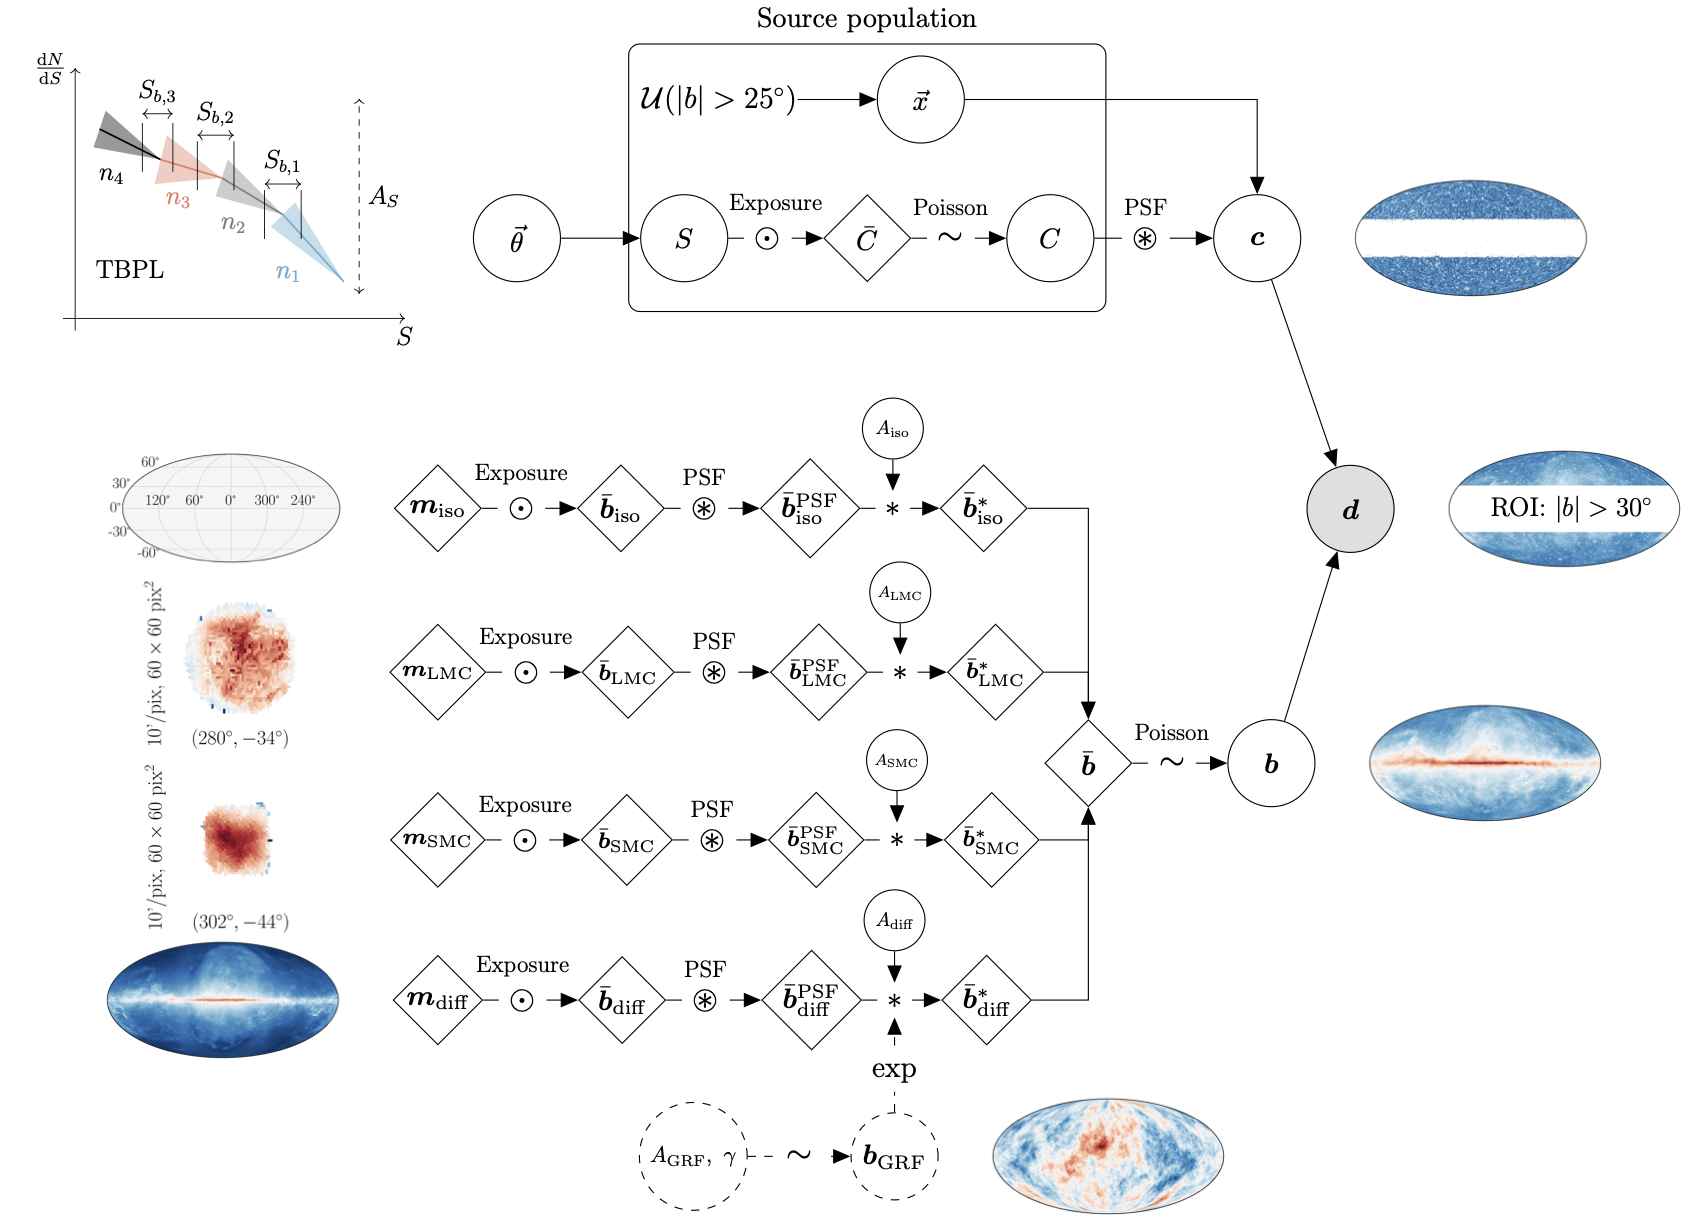
Gamma-ray astronomy
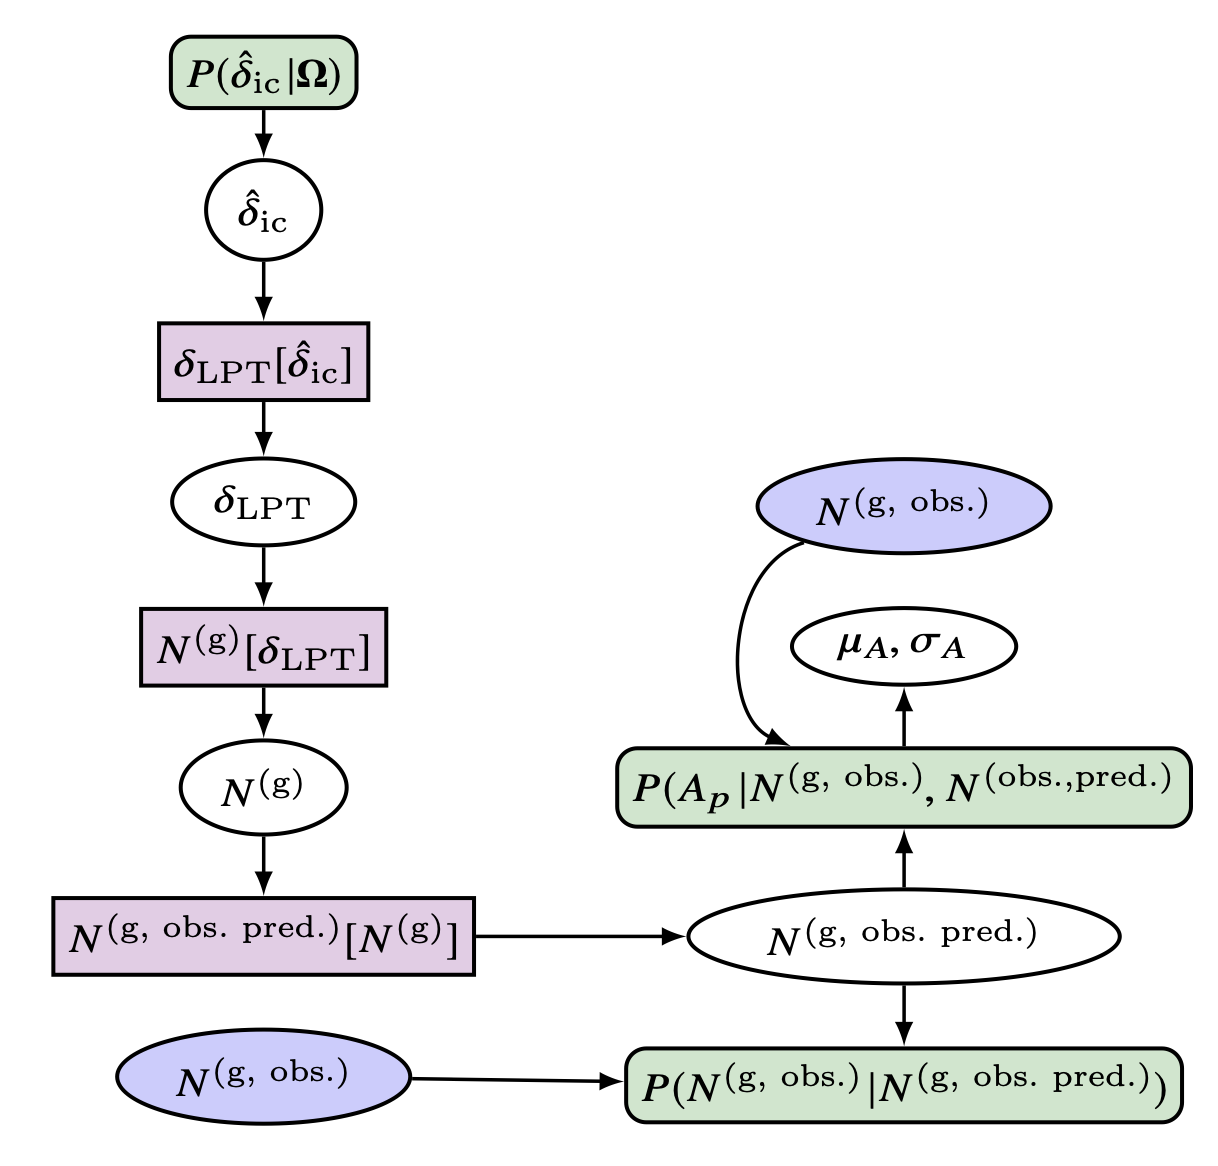
Cosmology
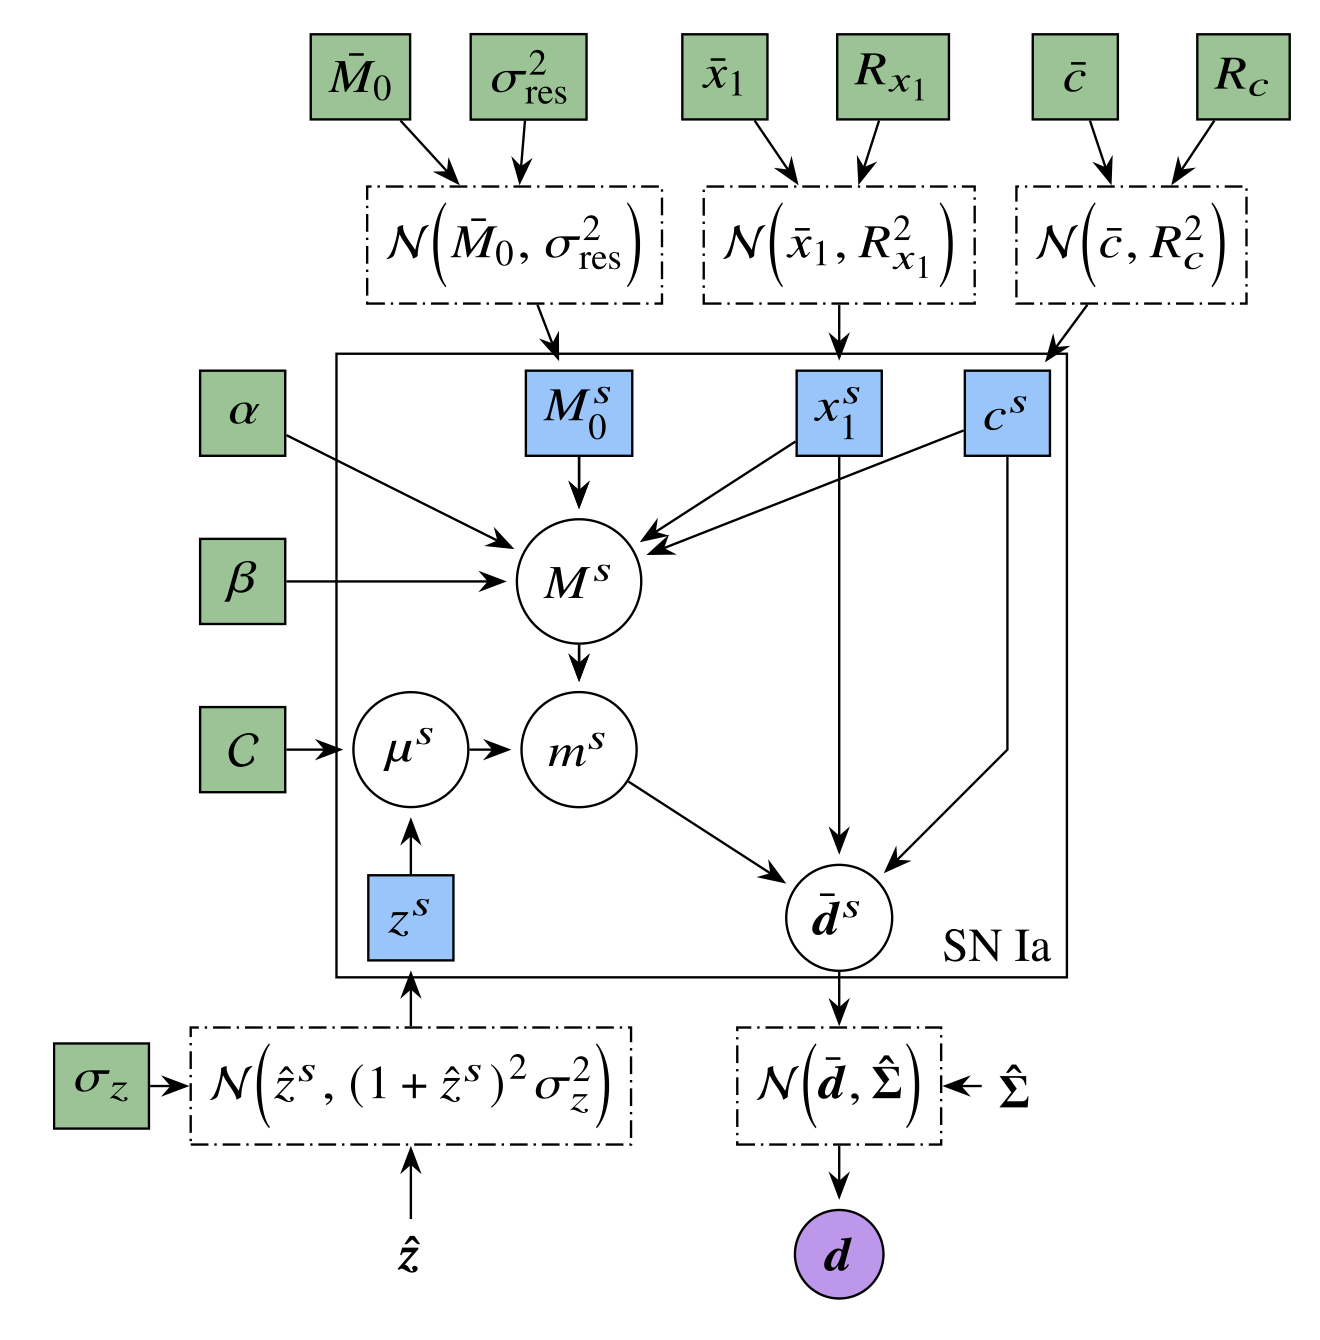
Supernova cosmology
- The high-latitude gamma-ray sky as seen by Fermi-LAT — Eckner et al. (2025), arXiv:2505.02906
- The cosmic matter density field behind SDSS-III/BOSS, from BORG — Lavaux et al. (2019), arXiv:1909.06396
- A population of Type Ia supernovae as standard candles — Karchev et al. (2022), arXiv:2209.06733
Falcon > Architecture
How Falcon is put together
Complex models defined declaratively, in YAML config files.
Every component becomes its own Ray actor, spread over whatever hardware there is.
All simulation data goes into one central, shared store.
The store feeds inference actors that learn the posteriors — and steer which simulations run next.
Falcon > Dynamic SBI
Dropping the rounds — faster, same posterior
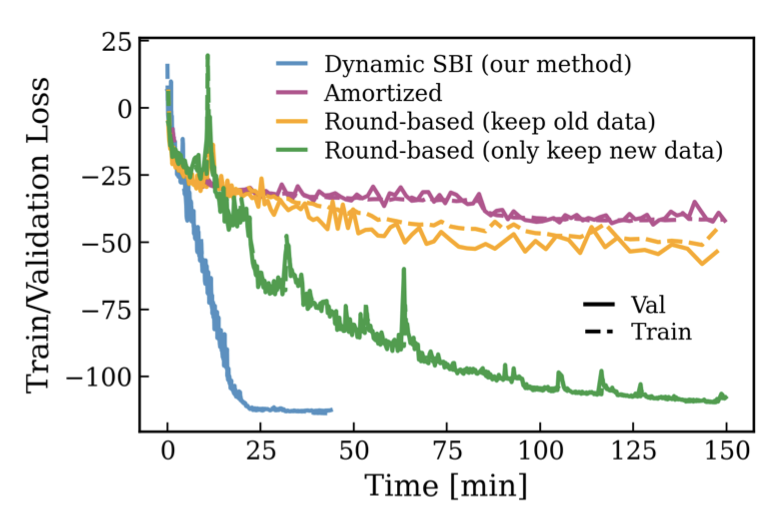
10D benchmark: loss vs. wall clock
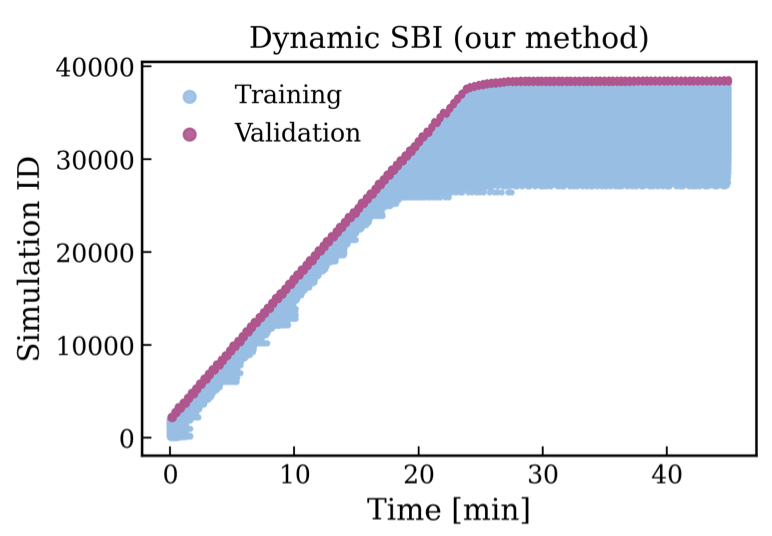
same run: which simulations sit in the training set, over time
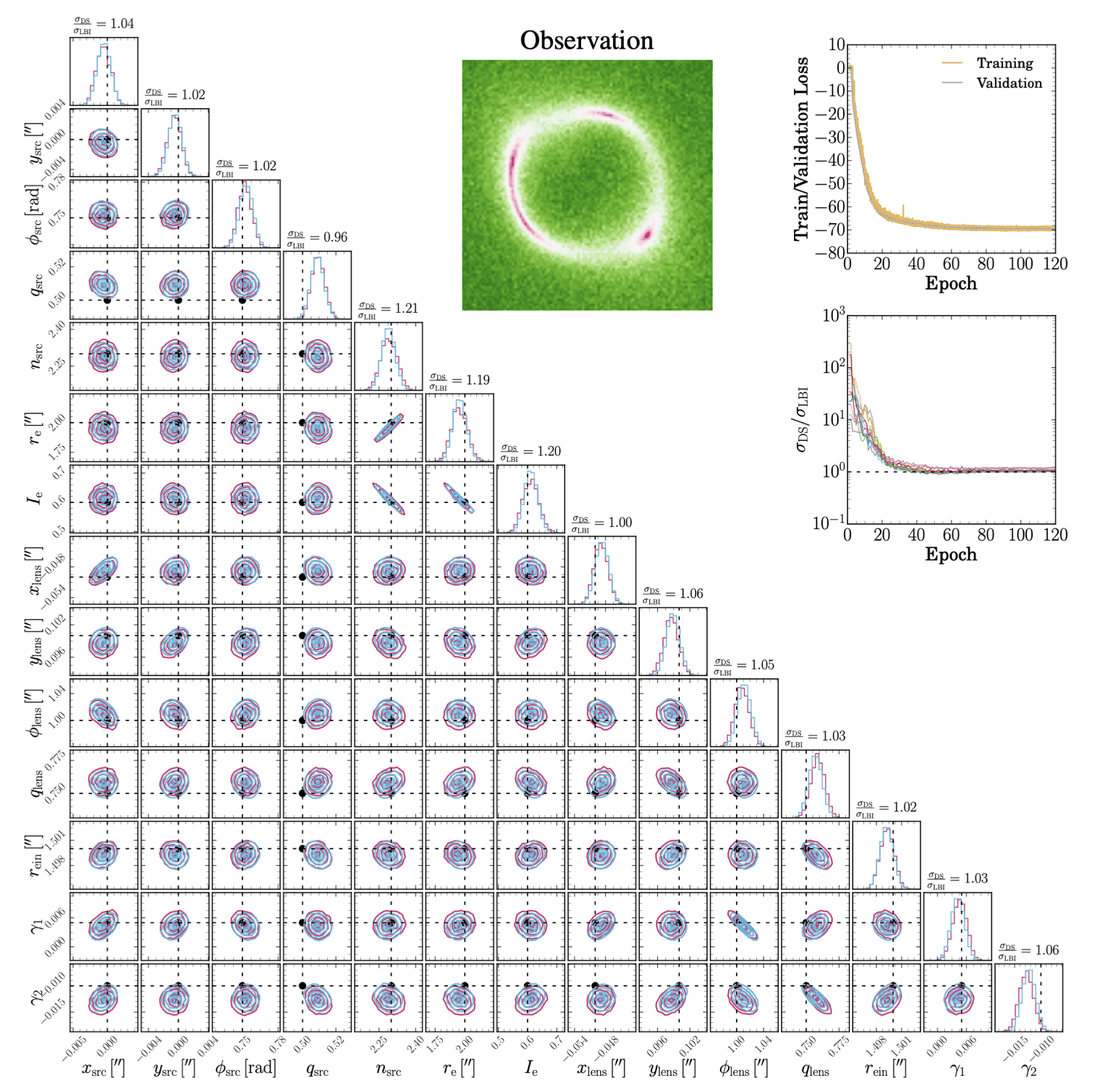
strong lensing, 14 parameters — Dynamic SBI (pink) vs. likelihood-based reference (blue)
Lyu et al. 2025 (Dynamic SBI), arXiv:2510.13997 — left: 10D benchmark (Fig. 3); right: strong lensing (Fig. 5).
Falcon > Status
It works — and it is being used
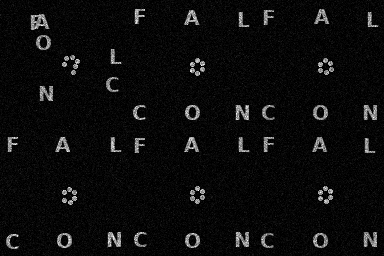
click to replay
The animation is this example's own run. Two independent latent components — a snake and the FALCON letters — each rendered, then composited into one noisy image. Both inference actors see only \(x\), and each steers what its own branch simulates next — the round-by-round contraction the animation shows. github.com/cweniger/falcon → examples/03_composite
- Radio interferometry: Joined reconstruction of radio images and antenna calibrations
- Cosmology: Sequential SBI reconstruction of cosmological fields.
- Gravitational waves — see the next slide
Falcon > LISA
A massive black-hole binary, from the full prior PRELIMINARY
LDC1-1, sequential SBI started from the full LDC prior: all-sky, ±half a day in \(t_c\), signed spins. No narrowed prior, no template bank.
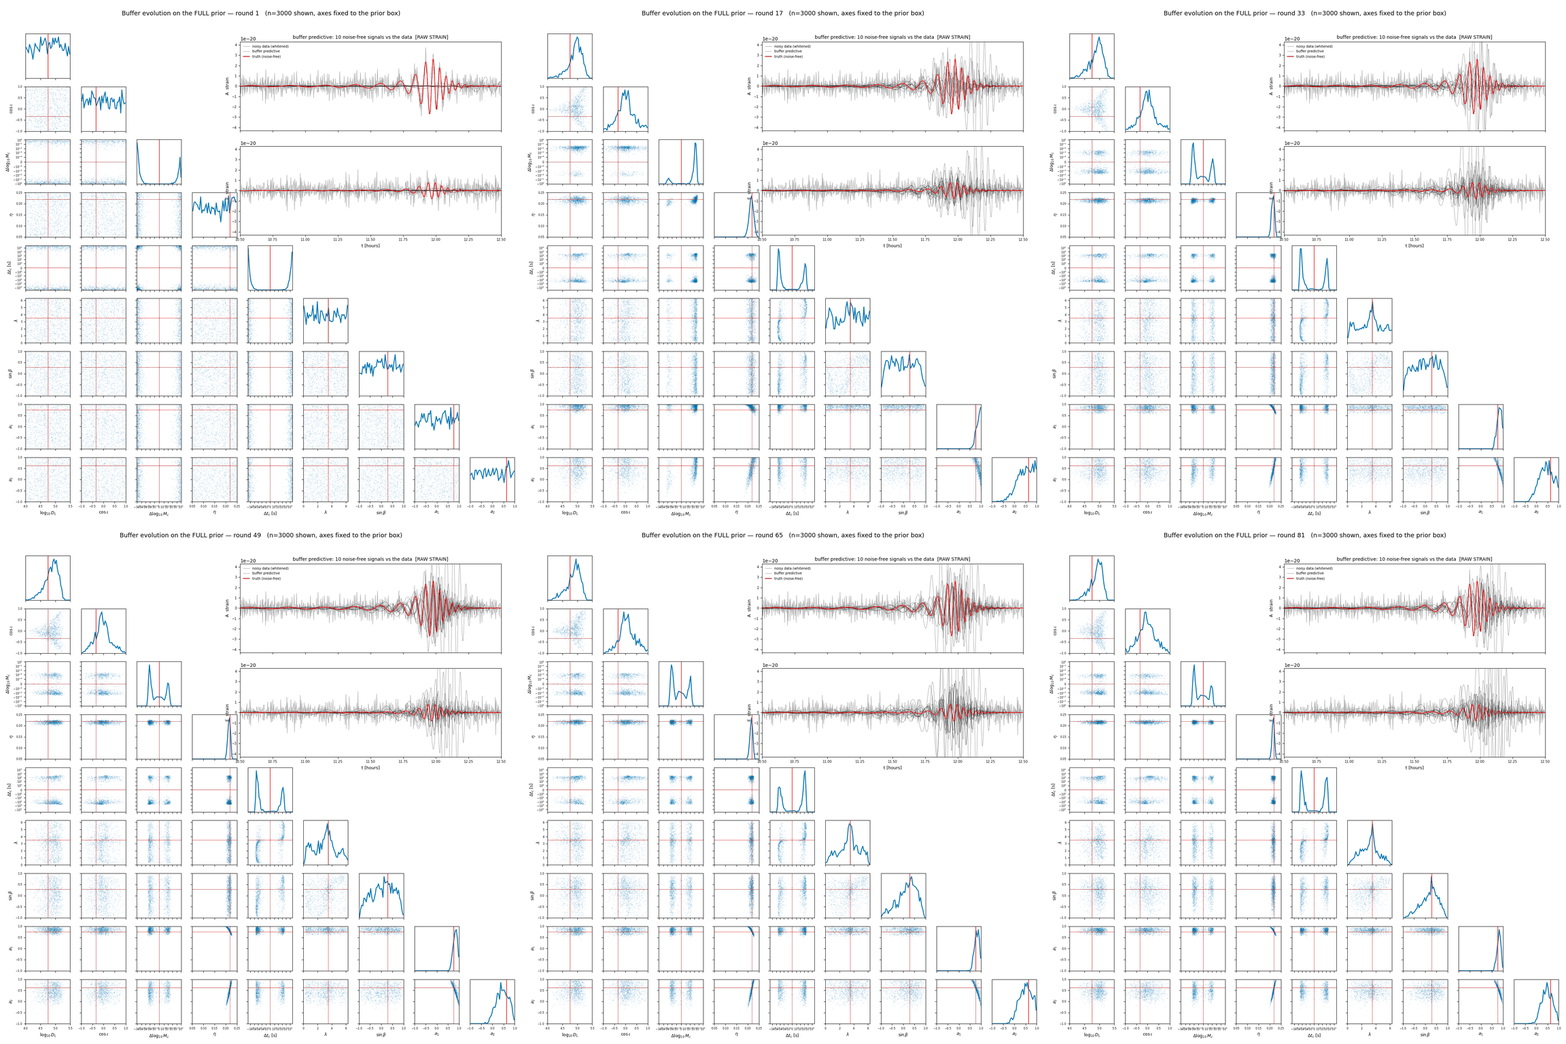
training buffer, round by round
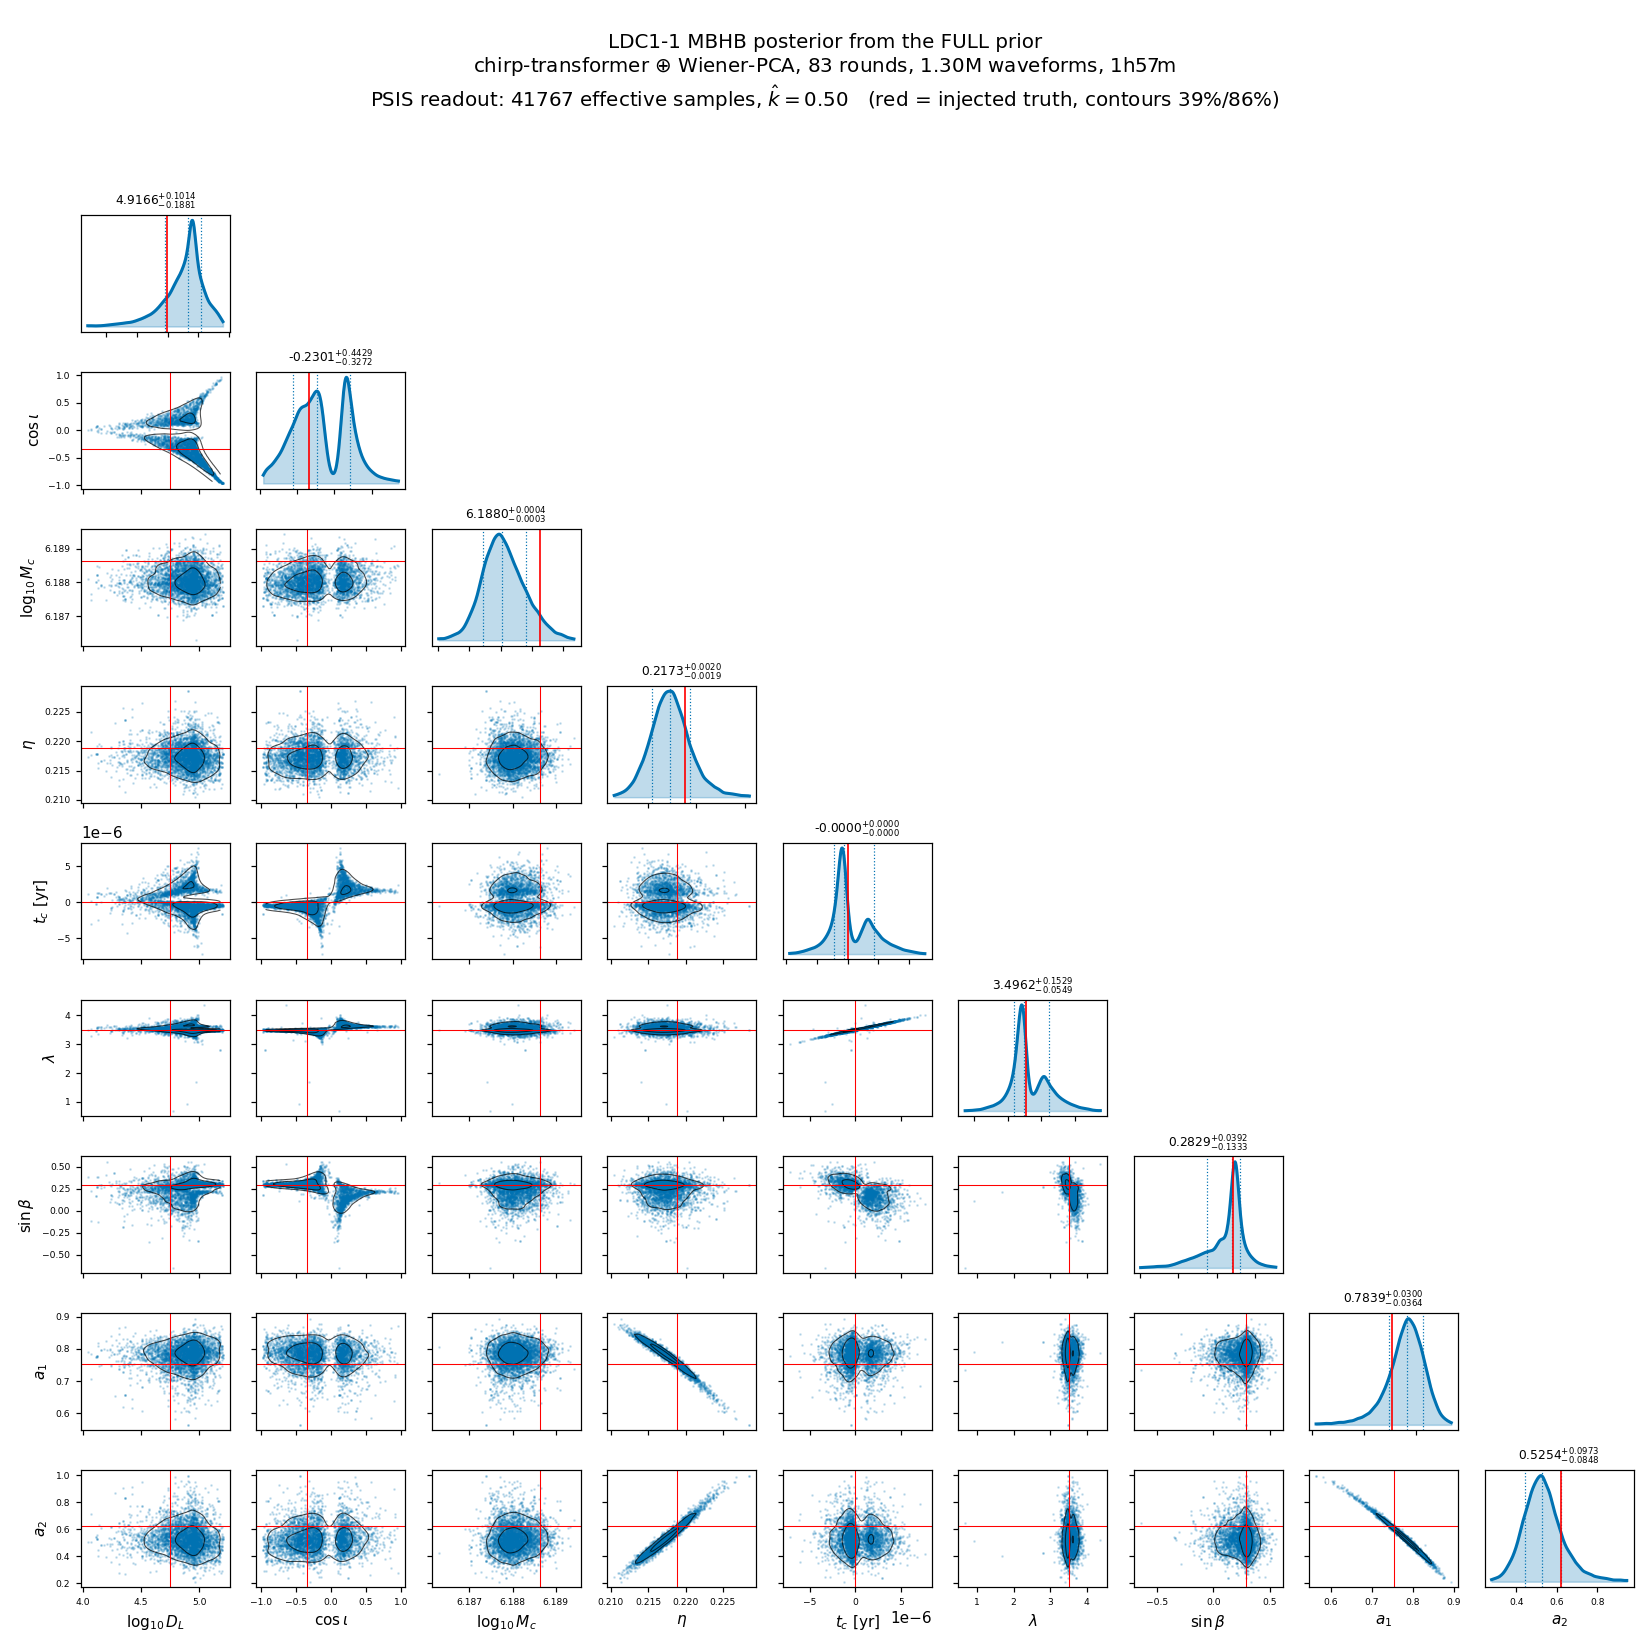
final posterior (red = injected truth)
83 rounds · 1.30M waveforms · 1 h 57 m on one GPU · 8 of 9 parameters within 1σ
H. Lyu et al., in prep. — LISA global-fit effort
Falcon > Open questions
Open questions
- Composition. Which conditional independencies are assumed and which are actually learned — and do the pieces compose into a consistent joint, or only into a set of plausible marginals?
- Diagnostics. Do the rank-based tests of Section 1 still apply — to each piece and to the composition?
- Scaling. How does cost grow with the number of overlapping sources, at a simulation budget matched against parallel-tempered MCMC (PTMCMC), the established global-fit baseline?
- Orchestration. What is worth simulating next, and how much idle time does dropping the rounds actually buy?
- Robustness. Misspecification and outliers, where the diagnostics are weakest.
- From bespoke to standard. Dynamic and distributed SBI as tools, not a new pipeline per analysis.